Market Outlook
August 22, 2017
Market Cues
Domestic Indices
Chg (%)
(Pts)
(Close)
Indian markets are likely to open Positive tracking global cues and SGX Nifty.
BSE Sensex
(0.8)
(266)
31,259
The U.S. equity indices recovered from early move to downside, stocks showed a
Nifty
(0.8)
(83)
9,754
lack of direction over the course of the trading session. The early weakness on Wall
Mid Cap
(1.5)
(221)
14,987
Street came as traders continued to express concerns about President Donald
Small Cap
(1.0)
(150)
15,468
Trump's ability to implement his pro-business agenda and geo political tension.
Bankex
(0.6)
(158)
27,026
Thought selling pressure remained relatively subdued due to lack of major U.S.
economic data.
The major averages eventually ended the session mixed. While the NASDAQ edged
Global Indices
Chg (%)
(Pts)
(Close)
down 0.1 percent to 6,213, the Dow inched up 0.1 percent to 21,704 and the S&P
0.1
29
21,704
Dow Jones
0.9
174
20,579
500 ticked up 0.1 percent to 2,428.
(0.1)
(3)
6,213
Nasdaq
0.9
54
5,917
U.K. stocks sagged Monday, falling alongside European and Asian stocks as
(0.1)
(5)
7,319
FTSE
0.1
4
7,119
tensions between the U.S. and North Korea came back into focus. The FTSE 100
Nikkei
(0.4)
(77)
19,393
UKX, 0.1% to close at 7,319, falling for a third straight Day.
Hang Seng
0.4
107
27,155
On the domestic front, The Sensex gave up early gains to end lower by 266 points
Shanghai Com
0.6
18
3,287
as market heavyweight Infosys Ltd extended losses for a second session following
Vishal Sikkas resignation as the chief executive officer and managing director of the
Advances / Declines
BSE
NSE
company on Friday. The benchmark BSE index closed down by 0.84 per cent at
Advances
1,856
1,518
31,259, it’s lowest in five sessions, while the broader NSE index ended lower by
0.84 per cent lower at 9,754. Both the indexes fell for a second straight day.
Declines
1,785
1,197
Unchanged
123
65
News Analysis
Tata Motors to pump in `4kcr in FY18 to boost car, truck sales
Volumes (` Cr)
Detailed analysis is on Pg2
BSE
3,953
Investor’s Ready Reckoner
NSE
24,694
Key Domestic & Global Indicators
#Net Inflows (` Cr)
Net
Mtd
Ytd
Stock Watch: Latest investment recommendations on 150+ stocks
(1,849)
(9,903)
48,493
Refer Pg7 onwards
FII
(565)
(2,249)
41,972
(38)
4,434
55,380
MFs
804
4,895
14,333
Top Picks
CMP
Target
Upside
Company
Sector
Rating
(`)
(`)
(%)
Top Gainers
Price (`)
Chg (%)
Blue Star
Capital Goods
Accumulate
733
760
3.7
Manappuram
195
11.4
Dewan Housing FinanceFinancials
Buy
449
520
15.9
Gruh
499
3.5
Mahindra Lifespace
Real Estate
Buy
411
522
27.1
Hathway
33
3.1
Navkar Corporation
Others
Buy
187
265
41.7
KEI Industries
Capital Goods
Buy
221
258
16.9
Pcjeweller
383
3.0
More Top Picks on Pg5
Centurytex
1,221
2.8
Key Upcoming Events
Previous
Consensus
Date
Region
Event Description
Top Losers
Price (`)
Chg (%)
Reading
Expectations
Infy
874
(5.4)
Aug 23, 2017 Germany PMI Services
53.10
53.30
Aug 23, 2017 Germany PMI Manufacturing
58.10
57.60
Sintex
32
(5.1)
Aug 23, 2017 US
New home sales
610.00
610.00
Nilkamal
1,565
(5.1)
Aug 23, 2017 Euro Zone Euro-Zone Consumer Confidence
(1.70)
(1.80)
Jktyre
144
(5.0)
Aug 24, 2017 US
Initial Jobless claims
232.00
236.00
Oil
273
(4.8)
More Events on Pg7
#As on April 20, 2017
Market Outlook
August 22, 2017
News Analysis
Tata Motors to pump in `4kcr in FY18 to boost car, truck sales
Homegrown auto major Tata Motors said on Monday it will invest `4,000cr in the
current fiscal to bring new passenger and commercial vehicles to the market as
part of its turnaround strategy.
The company also expects to save over `1,500cr and add to the bottom line in its
domestic business through various cost optimisation exercises and hopes return to
the black in 2017-18.
Besides, it is looking at "temporary hibernation" of some of its production lines
across different plants in order to optimise manufacturing. Out of these six will be
in medium and heavy CV segments, while four products are in intermediate CV
category. The investment would be of `2,500cr but did not share product launch
details.
Economic and Political News
11 states to require GST compensation of `9,500cr in FY18: India Ratings
Economists' expectations of GDP growth: From 6.1% to 6.7% for Q1
Govt imposes anti-dumping duty on tempered glass from China for 5 years
Corporate News
Lupin Receives Establishment Inspection Report (EIR) from the U.S. FDA for its
Aurangabad facility
Biocon Board approves slump sale of its Biosimilars business to its subsidiary
HCL Infosystems Signs agreement with Apple India for distribution of iPhone
and other Apple products
V-Guard Acquires 6.72 lakh shares or 49.43 percent stake in GUTS Electro-
Mech
Market Outlook
August 22, 2017
Top Picks
Market Cap
CMP
Target
Upside
Company
Rationale
(` Cr)
(`)
(`)
(%)
Strong growth in domestic business due to its leadership
in acute therapeutic segment. Alkem expects to launch
Alkem Laboratories
21,625
1,809
2,161
19.5
more products in USA, which bodes for its international
business.
We expect the company would report strong profitability
Asian Granito
1,217
405
480
18.6
owing to better product mix, higher B2C sales and
amalgamation synergy.
Favorable outlook for the AC industry to augur well for
Cooling products business which is out pacing the
Blue Star
7,019
733
760
3.7
market growth. EMPPAC division's profitability to improve
once operating environment turns around.
With a focus on the low and medium income (LMI)
consumer segment, the company has increased its
Dewan Housing Finance
14,071
449
520
15.9
presence in tier-II & III cities where the growth
opportunity is immense.
Loan growth is likely to pick up after a sluggish FY17.
Karur Vysya Bank
8,352
138
160
15.8
Lower credit cost will help in strong bottom-line growth.
Increasing share of CASA will help in NIM improvement.
High order book execution in EPC segment, rising B2C
KEI Industries
1,717
221
258
16.9
sales and higher exports to boost the revenues and
profitability
Speedier execution and speedier sales, strong revenue
Mahindra Lifespace
2,108
411
522
27.1
visibility in short-to-long run, attractive valuations
Expected to benefit from the lower capex requirement
Music Broadcast
2,100
368
434
17.9
and 15 year long radio broadcast licensing.
Massive capacity expansion along with rail advantage at
Navkar Corporation
2,667
187
265
41.7
ICD as well CFS augurs well for the company
Strong brands and distribution network would boost
Siyaram Silk Mills
1,896
2,022
2,500
23.6
growth going ahead. Stock currently trades at an
inexpensive valuation.
Market leadership in Hindi news genre and no.
2
viewership ranking in English news genre, exit from the
TV Today Network
1,458
244
344
40.7
radio business, and anticipated growth in ad spends by
corporates to benefit the stock.
After GST, the company is expected to see higher
volumes along with improving product mix. The Gujarat
Maruti Suzuki
2,26,978
7,514
8,544
13.7
plant will also enable higher operating leverage which
will be margin accretive.
Source: Company, Angel Research
Market Outlook
August 22, 2017
Key Upcoming Events
Global economic events release calendar
Bloomberg Data
Date
Time
Country
Event Description
Unit
Period
Last Reported
Estimated
Aug 23, 2017
1:00 PMGermany
PMI Services
Value
Aug P
53.10
53.30
1:00 PMGermany
PMI Manufacturing
Value
Aug P
58.10
57.60
7:30 PMUS
New home sales
Thousands
Jul
610.00
610.00
7:30 PMEuro Zone
Euro-Zone Consumer Confidence
Value
Aug A
(1.70)
(1.80)
Aug 24, 2017
6:00 PMUS
Initial Jobless claims
Thousands
Aug 19
232.00
236.00
11:30 AMGermany
GDP nsa (YoY)
% Change
2Q F
0.80
0.80
2:00 PMUK
GDP (YoY)
% Change
2Q P
1.70
1.70
Aug 25, 2017
7:30 PMUS
Existing home sales
Million
Jul
5.52
5.56
Aug 29, 2017
7:30 PMUS
Consumer Confidence
S.A./ 1985=100
Aug
121.10
119.00
Aug 30, 2017
6:00 PMUS
GDP Qoq (Annualised)
% Change
2Q S
2.60
2.60
Aug 31, 2017
1:25 PMGermany
Unemployment change (000's)
Thousands
Aug
(8.00)
6:30 AMChina
PMI Manufacturing
Value
Aug
51.40
51.50
Sep 01, 2017
6:00 PMUS
Change in Nonfarm payrolls
Thousands
Aug
209.00
178.00
6:00 PMUS
Unnemployment rate
%
Aug
4.30
4.30
2:00 PMUK
PMI Manufacturing
Value
Aug
55.10
Sep 05, 2017
2:30 PMEuro Zone
Euro-Zone GDP s.a. (QoQ)
% Change
2Q F
0.60
Sep 07, 2017
5:15 PMEuro Zone
ECB announces interest rates
%
Sep 7
-
Sep 08, 2017
India
Exports YoY%
% Change
Aug
3.94
India
Imports YoY%
% Change
Aug
15.40
2:00 PMUK
Industrial Production (YoY)
% Change
Jul
0.30
China
Exports YoY%
% Change
Aug
7.20
Sep 09, 2017
7:00 AMChina
Consumer Price Index (YoY)
% Change
Aug
1.40
Sep 12, 2017
2:00 PMUK
CPI (YoY)
% Change
Aug
2.60
Source: Bloomberg, Angel Research
Market Outlook
August 22, 2017
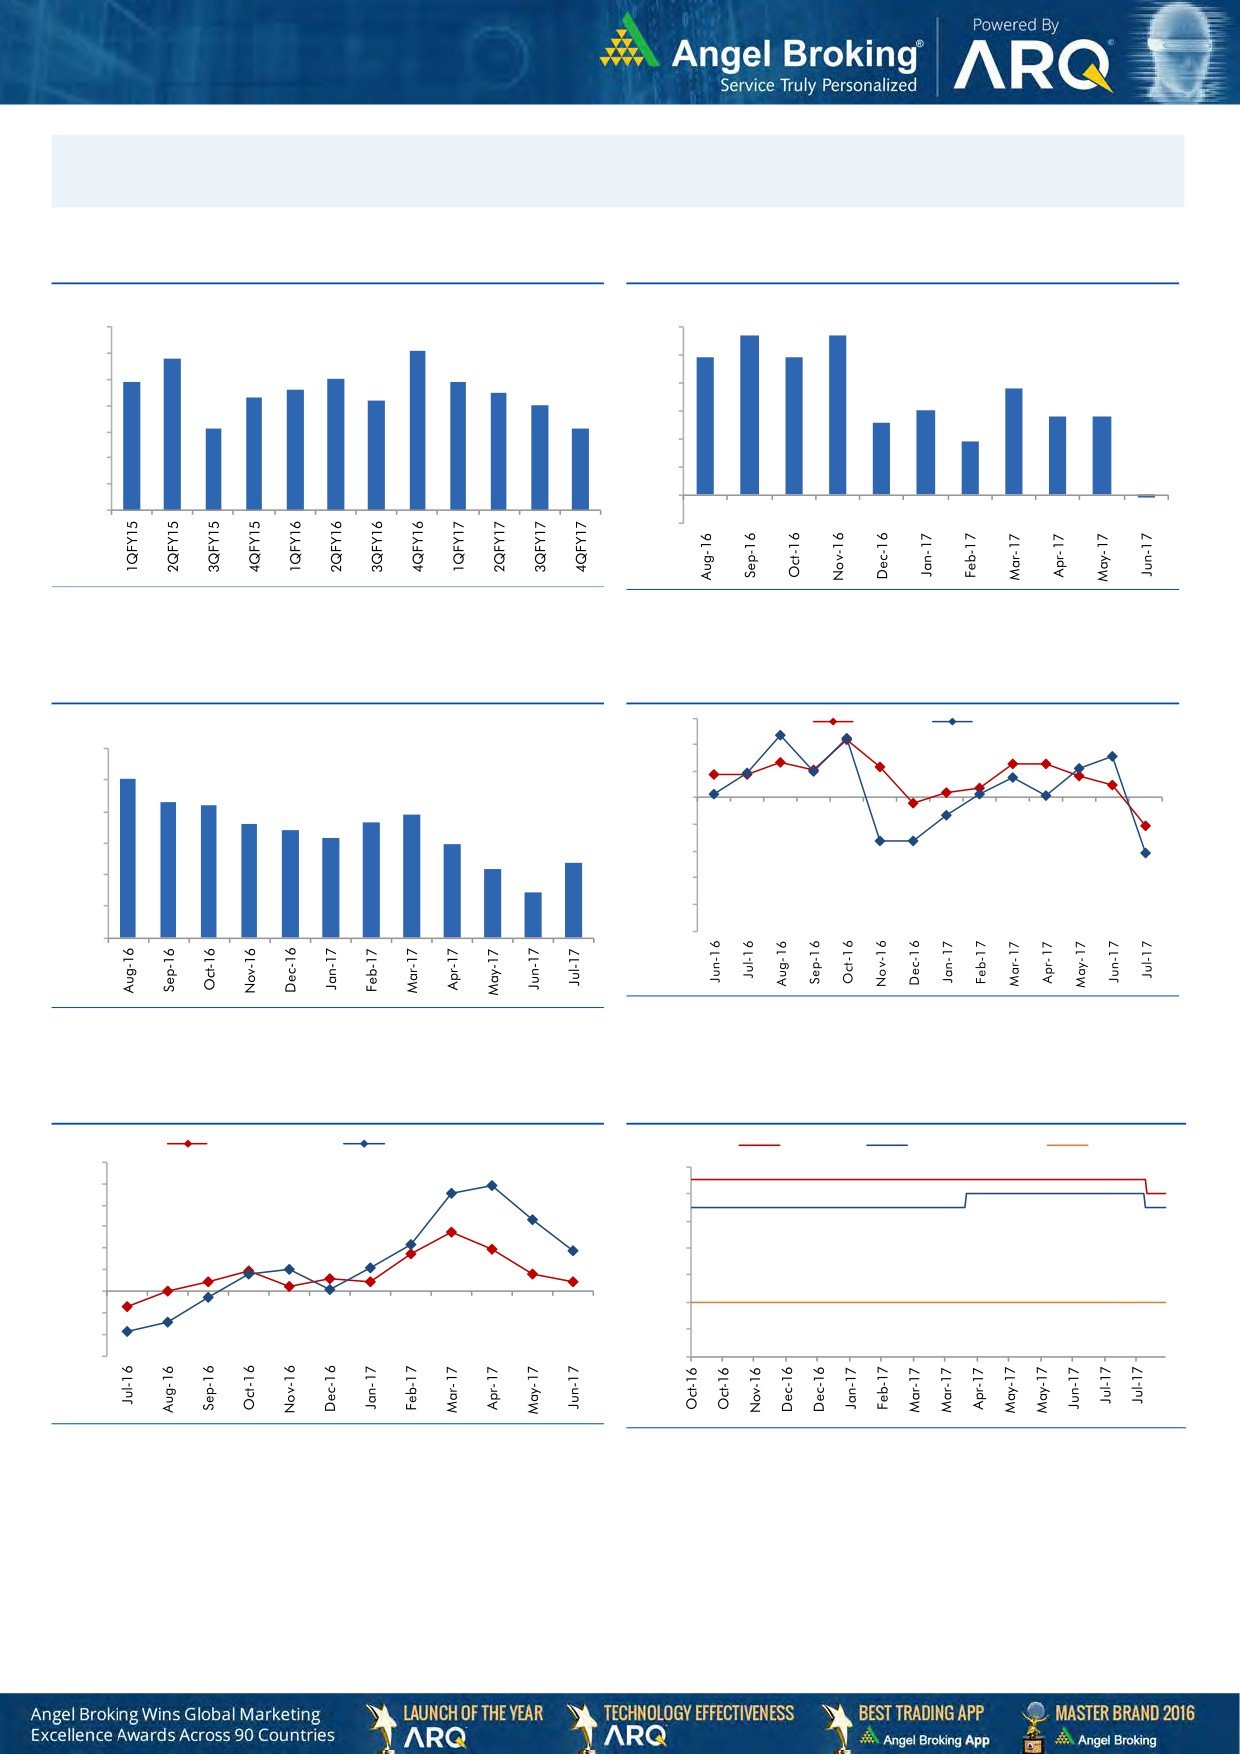
Macro watch
Exhibit 1: Quarterly GDP trends
Exhibit 2: IIP trends
(%)
(%)
5.7
5.7
10.0
6.0
9.1
8.8
4.9
4.9
9.0
5.0
7.9
8.0
7.9
7.6
7.5
3.8
8.0
7.3
7.2
4.0
7.0
3.0
2.8
2.8
7.0
2.6
6.1
6.1
3.0
1.9
6.0
2.0
5.0
1.0
4.0
-
3.0
(0.1)
(1.0)
Source: CSO, Angel Research
Source: MOSPI, Angel Research
Exhibit 3: Monthly CPI inflation trends
Exhibit 4: Manufacturing and services PMI
56.0
Mfg. PMI
Services PMI
(%)
6.0
54.0
5.1
52.0
5.0
4.3
4.2
3.9
50.0
3.6
3.7
4.0
3.4
3.2
3.0
48.0
3.0
2.4
2.2
46.0
2.0
1.5
44.0
1.0
42.0
40.0
-
Source: Market, Angel Research; Note: Level above 50 indicates expansion
Source: MOSPI, Angel Research
Exhibit 5: Exports and imports growth trends
Exhibit 6: Key policy rates
(%)
Exports yoy growth
Imports yoy growth
(%)
Repo rate
Reverse Repo rate
CRR
60.0
6.50
50.0
6.00
40.0
30.0
5.50
20.0
5.00
10.0
4.50
0.0
4.00
(10.0)
(20.0)
3.50
(30.0)
3.00
Source: Bloomberg, Angel Research
Source: RBI, Angel Research
Market Outlook
August 22, 2017
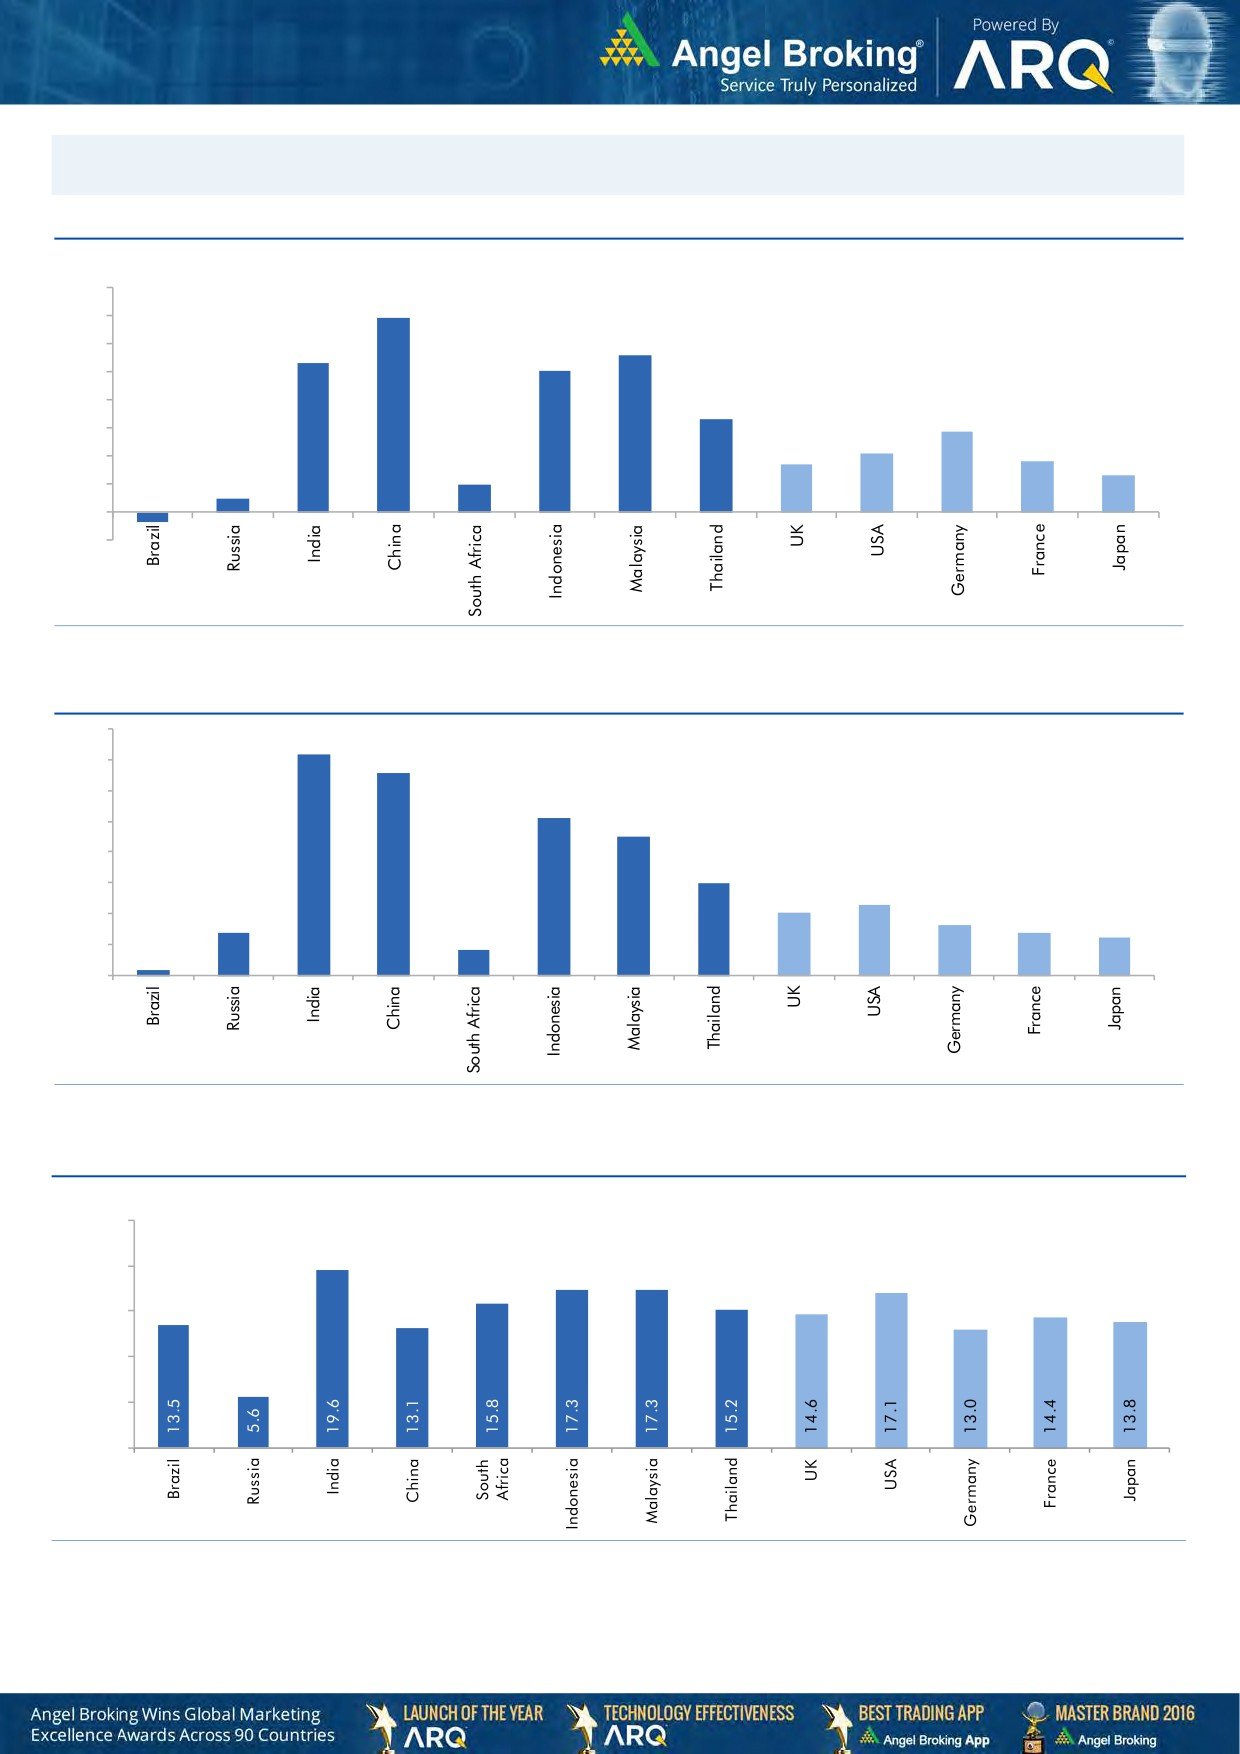
Global watch
Exhibit 1: Latest quarterly GDP Growth (%, yoy) across select developing and developed countries
(%)
8.0
6.9
7.0
5.6
6.0
5.3
5.0
1.0
5.0
4.0
3.3
2.9
3.0
2.1
0.5
1.7
1.8
2.0
1.3
1.0
-
(1.0)
(0.4)
Source: Bloomberg, Angel Research
Exhibit 2: 2016 GDP Growth projection by IMF (%, yoy) across select developing and developed countries
(%)
7.2
7.0
6.6
6.0
5.1
5.0
4.5
4.0
3.0
3.0
2.3
2.0
1.4
1.6
2.0
1.4
1.2
0.2
0.8
1.0
-
Source: IMF, Angel Research
Exhibit 3: One year forward P-E ratio across select developing and developed countries
(x)
25.0
20.0
15.0
10.0
5.0
-
Source: IMF, Angel Research
Market Outlook
August 22, 2017
Exhibit 4: Relative performance of indices across globe
Returns (%)
Country
Name of index
Closing price
1M
3M
1YR
Brazil
Bovespa
68,635
5.7
11.3
15.7
Russia
Micex
1,938
(0.5)
(0.7)
(2.6)
India
Nifty
9,754
(1.5)
3.5
12.9
China
Shanghai Composite
3,287
1.3
6.6
8.6
South Africa
Top 40
49,029
2.7
2.2
6.4
Mexico
Mexbol
51,241
0.2
4.5
6.1
Indonesia
LQ45
976
0.1
3.8
4.9
Malaysia
KLCI
1,772
0.9
0.3
5.2
Thailand
SET 50
999
0.3
1.9
1.0
USA
Dow Jones
21,704
0.4
4.3
17.1
UK
FTSE
7,319
(2.3)
(2.4)
6.6
Japan
Nikkei
19,393
(3.1)
(1.0)
14.6
Germany
DAX
12,066
(3.1)
(4.4)
14.6
France
CAC
5,088
(2.1)
(4.9)
15.0
Source: Bloomberg, Angel Research
Stock Watch
August 22, 2017
Company Name
Reco
CMP
Target
Mkt Cap
Sales ( Čcr )
OPM(%)
EPS (Č)
PER(x)
P/BV(x)
RoE(%)
EV/Sales(x)
(Č)
Price ( Č)
( Č cr )
FY18E FY19E
FY18E
FY19E
FY18E
FY19E
FY18E
FY19E
FY18E
FY19E
FY18E
FY19E
FY18E
FY19E
Agri / Agri Chemical
Rallis
Reduce
227
209
4,423
1,873
2,099
15.0
15.0
9.5
10.5
23.9
21.7
3.6
3.3
15.8
16.0
2.3
2.0
United Phosphorus
Neutral
810
-
41,153
18,922
21,949
18.0
18.5
36.2
45.6
22.4
17.8
4.7
3.9
22.7
23.8
2.3
2.0
Auto & Auto Ancillary
Ashok Leyland
Buy
102
124
29,953
23,339
27,240
10.1
10.8
4.7
6.2
22.0
16.5
4.4
3.9
20.0
23.6
1.2
1.0
Bajaj Auto
Accumulate
2,771
3,151
80,172
23,936
27,955
19.5
20.1
142.7
167.3
19.4
16.6
4.2
3.8
21.8
22.8
2.9
2.5
Bharat Forge
Neutral
1,137
-
26,476
7,637
8,755
21.7
23.2
36.1
47.3
31.5
24.1
5.7
4.8
18.5
20.8
3.3
2.8
Eicher Motors
Neutral
31,634
-
86,115
19,043
22,837
19.5
19.9
835.4
1,019.0
37.9
31.0
14.2
10.9
40.9
37.8
4.4
3.6
Gabriel India
Neutral
175
-
2,509
1,782
2,033
9.7
10.2
7.1
8.9
24.6
19.7
5.0
4.2
21.0
22.2
1.4
1.2
Hero Motocorp
Neutral
3,968
-
79,232
32,239
36,878
16.0
15.6
184.4
206.5
21.5
19.2
6.8
5.9
31.3
30.7
2.2
1.9
Jamna Auto Industries Neutral
251
-
2,003
1,441
1,662
14.4
14.8
13.9
17.6
18.1
14.3
4.9
4.0
30.0
31.0
1.4
1.2
Mahindra and Mahindra Neutral
1,375
-
85,391
46,971
53,816
13.6
14.0
67.7
79.8
20.3
17.2
2.9
2.6
15.0
15.9
1.7
1.4
Maruti
Accumulate
7,514
8,544
226,978
81,825
101,245
15.0
15.0
283.5
356.0
26.5
21.1
5.8
4.7
21.9
22.4
2.4
1.9
Minda Industries
Neutral
772
-
6,672
4,328
5,084
11.0
11.9
27.3
36.4
28.3
21.2
6.0
4.7
23.1
25.6
1.6
1.4
Motherson Sumi
Neutral
320
-
67,407
55,937
64,445
10.8
11.4
16.9
21.1
19.0
15.2
4.2
4.3
25.2
25.4
1.3
1.1
Tata Motors
Neutral
375
-
108,146
303,167
343,649
11.8
13.8
33.1
54.7
11.3
6.9
1.9
1.5
16.9
23.0
0.4
0.3
TVS Motor
Neutral
575
-
27,325
13,992
16,216
9.0
9.4
17.1
20.3
33.7
28.3
9.0
6.9
29.7
27.7
1.9
1.6
Amara Raja Batteries
Accumulate
760
858
12,981
6,140
7,122
14.3
15.6
29.3
39.0
25.9
19.5
4.4
3.7
17.1
19.0
2.1
1.8
Exide Industries
Neutral
201
-
17,123
8,689
9,854
15.1
15.2
9.7
11.0
20.9
18.3
3.7
3.3
15.7
16.1
1.7
1.5
Apollo Tyres
Neutral
268
-
13,639
15,739
17,326
13.3
14.6
20.4
26.7
13.1
10.0
1.6
1.4
20.4
26.7
1.1
1.0
Ceat
Neutral
1,676
-
6,778
6,661
7,717
11.1
14.2
116.2
178.2
14.4
9.4
2.5
2.1
15.2
21.3
1.1
1.0
JK Tyres
Neutral
144
-
3,262
8,318
9,239
16.2
16.4
21.0
27.5
6.9
5.2
1.3
1.1
19.1
20.4
0.8
0.7
Swaraj Engines
Neutral
1,999
-
2,483
788
889
16.4
16.5
71.6
81.0
27.9
24.7
8.1
7.5
29.6
31.0
2.8
2.4
Subros
Neutral
226
-
1,355
1,855
2,135
11.6
11.8
10.3
14.7
22.0
15.4
3.4
2.9
15.8
19.1
0.9
0.8
Capital Goods
BEML
Neutral
1,832
-
7,628
4,286
5,194
7.1
8.2
42.9
58.1
42.7
31.5
3.5
3.2
7.6
8.7
1.8
1.5
Bharat Electronics
Neutral
179
-
40,004
10,258
12,470
19.6
19.5
7.3
8.6
24.5
20.8
0.5
0.4
20.4
21.9
3.4
2.8
Voltas
Neutral
532
-
17,591
6,778
8,004
9.6
11.0
17.1
22.4
31.1
23.7
7.4
6.5
17.7
19.8
2.3
1.9
BHEL
Neutral
125
-
30,571
33,200
39,167
6.8
9.5
6.2
11.2
20.2
11.2
0.9
0.9
4.6
8.0
0.5
0.4
Blue Star
Neutral
733
-
7,019
5,101
5,997
6.0
7.0
17.9
26.6
41.0
27.6
8.7
8.0
21.9
29.0
1.4
1.2
CG Power and Industrial
Neutral
81
-
5,092
6,555
7,292
7.5
7.5
-
0.8
8,125.0
101.6
1.3
1.3
0.1
1.2
0.9
0.8
Solutions
Greaves Cotton
Neutral
145
-
3,545
1,778
1,993
14.7
15.1
8.1
9.1
17.9
16.0
4.0
3.8
21.8
23.6
1.8
1.6
Stock Watch
August 22, 2017
Company Name
Reco
CMP
Target
Mkt Cap
Sales ( Čcr )
OPM(%)
EPS (Č)
PER(x)
P/BV(x)
RoE(%)
EV/Sales(x)
(Č)
Price ( Č)
( Č cr )
FY18E FY19E
FY18E
FY19E
FY18E
FY19E
FY18E
FY19E
FY18E
FY19E
FY18E
FY19E
FY18E
FY19E
Capital Goods
KEC International
Neutral
297
-
7,637
9,779
11,113
9.4
9.8
14.2
18.2
20.9
16.3
4.0
3.3
21.1
22.1
1.0
0.9
KEI Industries
Buy
221
258
1,717
3,001
3,391
10.0
10.0
13.0
16.1
17.0
13.7
3.1
2.6
18.2
18.7
0.7
0.7
Thermax
Neutral
888
-
10,582
4,125
4,747
10.3
10.8
26.7
31.5
33.3
28.2
3.7
3.4
11.2
12.0
2.3
2.0
VATech Wabag
Accumulate
614
681
3,352
3,867
4,126
9.6
10.0
34.9
39.8
17.6
15.4
2.9
2.5
17.7
17.5
0.9
0.8
Cement
ACC
Neutral
1,790
-
33,615
12,255
13,350
13.5
14.3
58.0
66.2
30.9
27.0
3.7
3.4
11.5
12.2
2.7
2.5
Ambuja Cements
Neutral
276
-
54,794
10,250
11,450
17.5
19.0
7.2
8.3
38.3
33.3
2.8
2.6
7.0
7.8
5.1
4.5
India Cements
Neutral
178
-
5,491
6,135
6,750
14.8
15.2
8.5
11.5
21.0
15.5
1.0
1.0
4.8
6.2
1.2
1.1
JK Cement
Neutral
995
-
6,955
4,150
4,775
19.2
20.0
49.0
63.5
20.3
15.7
3.2
2.8
17.0
18.5
2.1
1.8
J K Lakshmi Cement
Neutral
413
-
4,863
3,422
3,757
15.5
17.0
13.5
23.2
30.6
17.8
3.2
2.7
10.8
15.5
1.8
1.6
Orient Cement
Neutral
151
-
3,097
2,215
3,233
16.8
17.0
5.9
6.9
25.6
21.9
2.0
1.8
10.8
10.1
2.4
1.6
UltraTech Cement
Neutral
4,010
-
110,091
28,250
35,150
20.2
23.5
77.5
122.2
51.7
32.8
4.4
4.0
9.6
14.8
4.4
3.5
Construction
KNR Constructions
Neutral
219
-
3,074
1,846
2,203
14.5
14.5
12.1
13.7
18.1
16.0
1.0
0.9
17.5
16.7
1.7
1.4
Larsen & Toubro
Neutral
1,127
-
157,743
95,787
109,476
10.2
11.6
44.5
50.8
25.3
22.2
3.2
2.9
12.9
13.1
2.2
1.9
Gujarat Pipavav Port
Neutral
137
-
6,609
739
842
61.6
62.7
5.1
6.2
26.8
22.2
3.3
3.3
12.7
14.9
8.4
7.3
PNC Infratech
Neutral
144
-
3,702
2,040
2,935
13.0
13.0
6.4
9.0
22.6
16.0
0.6
0.5
9.7
12.2
1.8
1.3
Simplex Infra
Neutral
496
-
2,452
6,012
6,619
11.6
11.7
21.1
31.0
23.6
16.0
1.6
1.5
6.5
8.6
0.9
0.9
Sadbhav Engineering
Accumulate
267
298
4,572
3,823
4,426
10.7
10.8
10.3
11.8
25.9
22.6
3.1
2.7
10.1
10.5
1.5
1.3
NBCC
Neutral
206
-
18,518
9,099
12,706
6.4
6.4
7.3
9.6
28.3
21.5
1.3
1.0
27.5
30.5
1.9
1.4
MEP Infra
Neutral
115
-
1,861
2,403
2,910
18.3
16.8
2.4
6.1
48.7
18.8
18.5
12.5
35.2
55.8
1.9
1.6
SIPL
Neutral
102
-
3,593
2,060
2,390
46.8
47.7
(5.8)
(3.1)
3.8
4.4
(14.2)
(2.3)
6.5
6.1
Engineers India
Neutral
149
-
10,014
1,795
2,611
21.1
22.4
5.9
8.1
25.2
18.4
1.8
1.7
12.9
16.1
4.0
2.6
Financials
Axis Bank
Buy
494
580
118,459
32,558
35,843
3.5
3.2
27.8
41.0
17.8
12.0
1.9
1.7
11.4
14.9
-
-
Bank of Baroda
Neutral
142
-
32,708
22,533
26,079
2.4
2.4
12.0
20.9
11.8
6.8
0.8
0.7
6.6
11.0
-
-
Canara Bank
Neutral
327
-
19,528
17,925
20,235
2.0
2.1
18.5
36.5
17.7
9.0
0.7
0.6
3.4
6.2
-
-
Can Fin Homes
Neutral
2,794
-
7,437
586
741
3.5
3.5
107.8
141.0
25.9
19.8
5.7
4.6
24.1
25.6
-
-
Cholamandalam Inv. &
Accumulate
1,151
1,230
17,982
2,826
3,307
6.3
6.3
53.7
64.6
21.5
17.8
3.7
3.1
18.3
18.9
-
-
Fin. Co.
Dewan Housing Finance Buy
449
520
14,071
2,676
3,383
2.4
2.7
37.4
49.7
12.0
9.0
1.6
1.4
13.8
16.2
-
-
Equitas Holdings
Buy
156
235
5,278
1,125
1,380
9.6
9.8
1.5
6.0
103.9
26.0
2.4
2.2
2.4
8.2
-
-
Federal Bank
Buy
106
125
20,613
4,896
5,930
2.8
3.1
5.4
7.6
19.8
14.0
1.7
1.5
8.5
11.0
-
-
Stock Watch
August 22, 2017
Company Name
Reco
CMP
Target
Mkt Cap
Sales ( Čcr )
OPM(%)
EPS (Č)
PER(x)
P/BV(x)
RoE(%)
EV/Sales(x)
(Č)
Price ( Č)
( Č cr )
FY18E FY19E
FY18E
FY19E
FY18E
FY19E
FY18E
FY19E
FY18E
FY19E
FY18E
FY19E
FY18E
FY19E
Financials
HDFC Bank
Neutral
1,744
-
449,182
55,236
63,253
4.5
4.4
68.9
82.4
25.3
21.2
4.4
3.7
18.7
18.5
-
-
ICICI Bank
Accumulate
293
315
187,939
42,361
51,378
3.6
3.9
18.4
25.7
15.9
11.4
1.7
1.7
11.3
15.0
-
-
Karur Vysya Bank
Buy
138
160
8,352
3,289
3,630
3.7
3.9
10.8
14.1
12.8
9.8
1.5
1.4
12.5
14.7
-
-
LIC Housing Finance
Neutral
649
-
32,735
4,895
6,332
3.4
3.7
50.7
66.8
12.8
9.7
2.6
2.1
21.7
23.8
-
-
Punjab Natl.Bank
Neutral
138
-
29,323
23,708
25,758
2.1
2.1
5.9
16.4
23.5
8.4
0.7
0.7
3.0
8.3
-
-
RBL Bank
Neutral
507
-
19,248
2,309
2,888
2.6
2.5
16.4
19.1
31.0
26.6
3.9
3.5
13.3
13.8
-
-
Repco Home Finance
Buy
643
825
4,024
496
597
4.4
4.2
38.5
48.7
16.7
13.2
3.0
2.5
19.6
20.6
-
-
South Ind.Bank
Neutral
27
-
4,872
3,195
3,567
3.0
3.1
3.0
3.8
8.9
7.1
0.9
0.8
10.5
11.9
-
-
St Bk of India
Neutral
275
-
237,079
105,827
121,056
2.4
2.5
16.1
25.6
17.1
10.7
1.3
1.2
6.6
9.9
-
-
Union Bank
Neutral
131
-
9,012
14,650
16,225
2.3
2.3
23.1
32.5
5.7
4.0
0.4
0.4
7.1
9.2
-
-
Yes Bank
Neutral
1,718
-
78,619
11,088
13,138
3.0
2.9
84.0
99.3
20.5
17.3
3.1
2.7
16.3
16.8
-
-
FMCG
Akzo Nobel India
Neutral
1,744
-
8,362
3,164
3,607
13.8
13.7
58.6
67.9
29.8
25.7
7.3
6.4
24.5
25.1
2.5
2.2
Asian Paints
Neutral
1,135
-
108,912
17,603
20,615
18.6
18.6
2,128.9
2,543.3
0.5
0.5
11.2
9.5
28.0
28.9
6.0
5.0
Britannia
Neutral
4,236
-
50,861
9,690
11,278
14.8
15.4
84.0
101.0
50.4
41.9
18.4
14.6
40.6
39.0
5.2
4.5
Colgate
Neutral
1,078
-
29,306
4,420
5,074
24.9
25.3
28.6
32.8
37.7
32.9
14.9
12.0
43.8
40.5
6.4
5.5
Dabur India
Neutral
304
-
53,559
8,346
9,344
19.6
19.9
7.8
9.0
39.0
33.8
7.9
7.1
25.2
24.8
6.0
5.3
GlaxoSmith Con*
Neutral
5,376
-
22,608
5,072
5,760
18.2
18.4
176.3
199.2
30.5
27.0
6.5
5.9
21.2
21.7
3.8
3.3
Godrej Consumer
Neutral
905
-
61,660
10,171
11,682
20.8
21.5
21.7
27.1
41.7
33.4
9.4
8.1
22.3
23.4
6.2
5.3
HUL
Neutral
1,193
-
258,253
37,077
41,508
20.3
21.8
5,189.9
6,318.5
0.2
0.2
36.4
31.1
74.8
82.0
6.8
6.1
ITC
Neutral
282
-
343,464
44,588
49,853
37.0
37.3
9.6
11.0
29.4
25.7
7.2
6.9
25.1
27.3
7.2
6.4
Marico
Neutral
317
-
40,869
6,788
7,766
18.5
19.2
7.1
8.5
44.6
37.3
15.6
13.4
36.9
38.0
5.9
5.1
Nestle*
Neutral
6,618
-
63,805
10,083
11,182
20.0
20.9
119.7
141.3
55.3
46.8
194.8
178.1
36.7
39.8
6.0
5.4
Tata Global
Neutral
196
-
12,380
7,121
7,641
11.9
12.3
6.9
8.0
28.4
24.5
1.9
1.8
6.8
7.2
1.5
1.4
Procter & Gamble
Neutral
8,179
-
26,550
3,034
3,579
27.1
27.7
167.7
198.8
48.8
41.1
13.1
11.3
28.8
29.5
8.2
6.8
Hygiene
IT
HCL Tech^
Buy
873
1,014
124,555
52,342
57,053
20.9
20.9
62.8
67.6
13.9
12.9
3.1
2.7
22.4
20.6
2.1
1.8
Infosys
Buy
874
1,179
200,638
73,963
80,619
26.0
26.0
64.4
69.3
13.6
12.6
2.7
2.5
19.7
19.6
2.1
1.9
TCS
Accumulate
2,521
2,651
496,824
127,403
138,870
27.6
27.6
144.5
156.0
17.5
16.2
5.2
4.8
29.7
29.8
3.6
3.2
Tech Mahindra
Buy
431
533
42,052
31,015
33,496
15.0
15.0
35.6
38.1
12.1
11.3
2.1
1.9
17.0
16.3
1.1
1.0
Wipro
Neutral
288
-
140,323
58,536
61,858
20.3
20.3
18.2
19.1
15.8
15.1
2.5
2.1
14.6
13.4
2.3
2.2
Stock Watch
August 22, 2017
Company Name
Reco
CMP
Target
Mkt Cap
Sales ( Čcr )
OPM(%)
EPS (Č)
PER(x)
P/BV(x)
RoE(%)
EV/Sales(x)
(Č)
Price ( Č)
( Č cr )
FY18E FY19E
FY18E
FY19E
FY18E
FY19E
FY18E
FY19E
FY18E
FY19E
FY18E
FY19E
FY18E
FY19E
Media
D B Corp
Neutral
377
-
6,929
2,404
2,625
30.5
31.5
23.7
26.9
15.9
14.0
3.7
3.2
23.5
22.8
2.7
2.5
HT Media
Neutral
92
-
2,135
2,589
2,830
15.1
15.4
8.3
10.9
11.1
8.4
0.9
0.8
8.4
10.4
0.4
0.2
Jagran Prakashan
Buy
173
225
5,639
2,541
2,835
28.5
28.7
12.7
14.1
13.6
12.2
2.8
2.4
21.3
21.4
2.1
1.8
Sun TV Network
Neutral
719
-
28,352
3,238
3,789
51.9
55.1
30.9
38.0
23.3
18.9
6.6
5.8
30.0
31.0
8.3
7.0
Hindustan Media
Neutral
271
-
1,990
1,002
1,074
23.3
23.5
29.2
33.8
9.3
8.0
1.5
1.2
15.6
15.4
1.0
0.7
Ventures
TV Today Network
Buy
244
344
1,458
667
727
27.7
27.7
18.6
20.1
13.1
12.2
2.1
2.1
15.6
17.3
1.7
1.6
Music Broadcast Limited Buy
368
434
2,100
271
317
91.0
109.0
6.0
10.0
61.3
36.8
3.8
3.5
6.5
9.3
7.3
6.0
Metals & Mining
Coal India
Neutral
239
-
148,388
82,301
91,235
17.0
18.0
17.1
20.5
14.0
11.7
2.6
2.5
45.0
55.0
1.5
1.3
Hind. Zinc
Neutral
291
-
122,851
22,108
24,555
57.0
58.0
22.1
26.3
13.2
11.1
4.3
3.5
32.0
35.0
4.6
3.8
Hindalco
Neutral
225
-
50,478
102,350
105,355
13.5
14.5
21.5
24.5
10.5
9.2
1.4
1.2
15.0
15.2
1.1
1.0
JSW Steel
Neutral
234
-
56,478
64,500
68,245
21.1
21.5
20.1
21.2
11.6
11.0
2.1
1.8
-
-
1.6
1.5
NMDC
Neutral
121
-
38,378
10,209
11,450
47.0
48.0
11.1
12.1
10.9
10.0
1.5
1.4
-
-
3.3
3.0
SAIL
Neutral
59
-
24,553
54,100
63,555
3.0
10.0
(10.0)
1.5
39.6
0.8
0.8
-
-
1.4
1.2
Vedanta
Neutral
294
-
109,211
81,206
87,345
28.0
29.0
26.5
33.5
11.1
8.8
2.5
2.2
-
-
2.1
1.8
Tata Steel
Neutral
622
-
60,405
121,445
126,500
16.2
17.2
65.4
81.3
9.5
7.7
1.5
1.3
-
-
1.0
0.9
Oil & Gas
GAIL
Neutral
376
-
63,534
53,115
52,344
14.2
15.3
30.0
31.1
12.5
12.1
1.6
1.4
-
-
0.9
0.9
ONGC
Neutral
158
-
202,188
83,111
84,934
44.2
44.9
16.4
16.9
9.6
9.3
1.2
1.1
-
-
2.3
2.3
Indian Oil Corp
Neutral
413
-
200,646
396,116
432,560
8.5
8.8
40.1
42.2
10.3
9.8
1.8
1.6
-
-
0.7
0.6
Reliance Industries
Neutral
1,566
-
509,183
257,711
267,438
17.0
18.2
89.1
89.5
17.6
17.5
1.6
1.5
-
-
1.6
1.6
Pharmaceuticals
Alembic Pharma
Buy
514
600
9,693
3,903
4,584
18.2
19.2
21.8
27.2
23.6
18.9
4.3
3.6
19.8
20.6
2.5
2.1
Alkem Laboratories Ltd
Buy
1,809
2,161
21,625
6,901
7,850
18.4
19.1
85.0
100.5
21.3
18.0
4.3
3.6
20.2
20.1
3.1
2.7
Aurobindo Pharma
Buy
696
823
40,748
17,086
19,478
22.1
22.0
44.7
51.4
15.6
13.5
3.4
2.8
24.7
22.7
2.5
2.2
Aventis*
Neutral
3,992
-
9,194
2,508
2,862
16.8
16.8
139.9
153.8
28.5
26.0
4.1
3.4
23.5
25.8
3.3
2.7
Cadila Healthcare
Reduce
473
426
48,428
11,584
13,228
20.3
20.4
18.7
21.3
25.3
22.2
5.6
4.6
24.6
22.9
4.0
3.5
Cipla
Sell
561
461
45,122
16,619
19,437
15.4
16.2
19.7
24.3
28.5
23.1
3.2
2.9
12.0
13.2
2.9
2.4
Dr Reddy's
Buy
1,933
2,419
32,043
15,844
17,973
17.6
18.2
91.7
111.0
21.1
17.4
2.4
2.2
11.9
13.0
2.2
2.0
GSK Pharma*
Neutral
2,381
-
20,171
3,260
3,651
15.0
18.0
46.1
58.6
51.7
40.6
10.6
10.9
20.0
26.5
6.1
5.5
Indoco Remedies
Sell
194
153
1,784
1,154
1,310
14.9
14.9
11.3
12.7
17.1
15.3
2.4
2.2
15.0
15.0
1.7
1.4
Ipca labs
Buy
410
620
5,170
3,593
4,022
14.5
15.5
19.4
25.2
21.1
16.3
1.9
1.7
9.5
11.2
1.5
1.3
Stock Watch
August 22, 2017
Company Name
Reco
CMP
Target
Mkt Cap
Sales ( Čcr )
OPM(%)
EPS (Č)
PER(x)
P/BV(x)
RoE(%)
EV/Sales(x)
(Č)
Price ( Č)
( Č cr )
FY18E FY19E
FY18E
FY19E
FY18E
FY19E
FY18E
FY19E
FY18E
FY19E
FY18E
FY19E
FY18E
FY19E
Pharmaceuticals
Lupin
Buy
923
1,467
41,687
18,657
21,289
21.3
23.3
52.8
66.7
17.5
13.8
2.6
2.2
16.3
17.5
2.2
1.9
Natco Pharma
Accumulate
723
796
12,594
1,836
1,946
31.8
28.9
22.1
20.6
32.7
35.0
6.6
5.9
20.1
16.7
6.7
6.3
Sun Pharma
Buy
461
712
110,497
32,899
36,451
26.9
25.4
31.6
32.3
14.6
14.3
2.6
2.2
18.7
18.8
3.0
2.5
Syngene International
Buy
443
557
8,867
1,402
1,823
32.8
36.0
15.9
20.7
27.9
21.5
5.2
4.3
18.7
20.0
6.3
4.8
Power
Tata Power
Neutral
80
-
21,692
32,547
33,806
20.5
20.5
4.7
5.4
17.1
15.0
1.6
1.4
10.5
10.5
1.7
1.6
NTPC
Neutral
172
-
141,698
86,070
101,246
28.3
30.7
12.9
16.2
13.3
10.6
1.4
1.3
10.6
12.4
3.0
2.7
Power Grid
Neutral
220
-
115,095
29,183
32,946
89.7
90.0
18.0
20.8
12.3
10.6
2.0
1.8
17.7
18.2
7.9
7.3
Real Estate
Prestige Estate
Neutral
259
-
9,709
4,607
5,146
21.0
22.2
7.9
9.8
32.8
26.4
2.0
1.9
10.3
12.0
3.3
3.0
MLIFE
Buy
411
522
2,108
487
590
12.3
17.8
21.0
31.2
19.6
13.2
1.0
1.0
5.2
7.4
3.0
2.5
Telecom
Bharti Airtel
Neutral
419
-
167,491
97,903
105,233
36.0
36.3
9.3
11.1
45.1
37.9
2.2
2.1
5.0
5.6
2.7
2.4
Idea Cellular
Neutral
89
-
32,117
35,012
37,689
27.1
27.7
(4.4)
(2.7)
1.4
1.4
(6.8)
(4.6)
2.2
2.0
zOthers
Abbott India
Neutral
4,211
-
8,948
3,244
3,723
14.9
16.1
167.5
209.4
25.1
20.1
5.5
4.6
23.7
24.8
2.4
2.0
Asian Granito
Buy
405
480
1,217
1,169
1,286
12.5
12.5
16.0
19.7
25.3
20.5
2.7
2.4
10.7
11.6
1.3
1.1
Bajaj Electricals
Buy
328
395
3,329
4,646
5,301
6.7
7.6
16.1
22.3
20.4
14.7
3.3
2.8
16.4
19.2
0.7
0.6
Banco Products (India)
Neutral
207
-
1,478
1,530
1,695
13.2
12.7
19.0
20.0
10.9
10.3
1.7
1.5
0.2
0.2
0.9
97.0
Coffee Day Enterprises
Neutral
241
-
4,954
3,494
3,913
17.4
18.0
4.8
5.7
-
42.2
2.1
2.0
-
0.1
1.9
1.7
Ltd
Elecon Engineering
Neutral
49
-
544
171
201
15.0
16.2
36.0
43.0
1.4
1.1
0.1
0.1
0.1
0.1
2.6
2.2
Garware Wall Ropes
Neutral
872
-
1,907
928
1,003
15.2
15.2
39.4
43.2
22.1
20.2
3.7
3.1
16.5
15.4
1.9
1.7
Goodyear India*
Neutral
809
-
1,866
1,717
1,866
11.8
12.3
47.9
49.8
16.9
16.3
2.6
2.3
15.6
15.7
0.8
111.9
Hitachi
Neutral
2,028
-
5,516
2,355
2,715
10.3
10.8
49.0
60.9
41.4
33.3
9.7
7.7
0.2
0.2
2.4
2.0
HSIL
Neutral
354
-
2,556
2,240
2,670
14.6
15.0
17.0
22.0
20.8
16.1
1.7
1.6
0.1
0.1
1.4
1.1
Interglobe Aviation
Neutral
1,271
-
45,963
22,570
27,955
14.2
15.0
63.6
81.8
20.0
15.5
10.5
8.9
0.5
0.6
1.7
1.3
Jyothy Laboratories
Neutral
375
-
6,815
1,781
2,044
14.1
15.0
9.4
10.5
40.1
35.7
8.5
8.0
0.2
0.2
4.0
3.5
Linc Pen & Plastics
Neutral
245
-
362
420
462
9.3
9.3
15.3
17.1
16.0
14.3
2.7
2.8
16.9
19.5
0.9
0.8
M M Forgings
Neutral
609
-
735
542
642
20.1
21.0
41.6
56.8
14.6
10.7
2.0
1.7
0.1
0.2
1.8
1.6
Mirza International
Neutral
155
-
1,861
1,148
1,285
18.0
18.0
8.0
9.4
19.3
16.5
3.2
2.7
16.3
16.1
1.8
1.6
Navkar Corporation
Buy
187
265
2,667
561
617
41.5
41.5
11.5
12.7
16.3
14.7
1.7
1.5
10.5
10.4
5.4
4.7
Nilkamal
Neutral
1,569
-
2,341
2,317
2,525
11.4
11.1
96.0
105.0
16.3
14.9
2.8
2.4
0.2
0.2
1.0
0.9
Parag Milk Foods
Neutral
236
-
1,986
1,987
2,379
7.6
9.0
12.4
18.3
19.0
12.9
2.7
2.4
8.2
13.2
1.1
0.9
Stock Watch
August 22, 2017
Company Name
Reco
CMP
Target Mkt Cap
Sales ( Čcr )
OPM(%)
EPS (Č)
PER(x)
P/BV(x)
RoE(%)
EV/Sales(x)
(Č)
Price ( Č)
( Č cr )
FY18E FY19E FY18E FY19E FY18E FY19E FY18E FY19E FY18E FY19E FY18E FY19E FY18E FY19E
zOthers
Radico Khaitan
Neutral
161
-
2,141
1,811
1,992
13.2
13.2
8.1
8.8
19.9
18.3
2.0
2.2
10.1
12.0
1.5
1.4
Relaxo Footwears
Neutral
488
-
5,862
1,981
2,310
13.7
14.5
12.0
15.5
40.7
31.5
7.9
6.4
0.2
0.2
3.0
2.6
Siyaram Silk Mills
Buy
2,022
2,500
1,896
1,769
1,981
12.7
12.7
113.1
131.1
17.9
15.4
2.8
2.4
15.5
15.5
1.3
1.1
Styrolution ABS India* Neutral
909
-
1,599
1,800
1,980
8.0
8.1
42.0
46.2
21.6
19.7
2.4
2.2
0.1
0.1
1.0
0.9
Surya Roshni
Neutral
276
-
1,208
4,870
5,320
7.7
7.8
22.8
28.1
12.1
9.8
1.6
1.4
0.1
0.1
0.5
0.4
TVS Srichakra
Neutral
3,408
-
2,609
2,729
2,893
12.7
12.5
248.5
265.0
13.7
12.9
3.9
3.2
0.3
0.3
1.0
0.9
Visaka Industries
Neutral
521
-
827
1,104
1,214
12.1
12.6
31.0
37.9
16.8
13.8
2.0
1.8
0.1
0.1
1.0
0.9
VIP Industries
Accumulate
207
218
2,919
1,450
1,693
10.4
10.5
6.5
7.8
31.6
26.5
6.7
5.8
21.1
22.1
2.0
1.7
Navin Fluorine
Accumulate
673
730
3,315
945
1,154
22.4
22.6
28.7
34.8
23.5
19.4
3.9
3.3
-
-
3.0
2.4
Source: Company, Angel Research; Note: *December year end; #September year end; &October year end; Price as on August 21, 2017
Market Outlook
August 22, 2017
Research Team Tel: 022 - 39357800
DISCLAIMER
Angel Broking Private Limited (hereinafter referred to as “Angel”) is a registered Member of National Stock Exchange of India
Limited,Bombay Stock Exchange Limited and Metropolitan Stock Exchange Limited. It is also registered as a Depository Participant with
CDSL and Portfolio Manager with SEBI. It also has registration with AMFI as a Mutual Fund Distributor. Angel Broking Private Limited is a
registered entity with SEBI for Research Analyst in terms of SEBI (Research Analyst) Regulations, 2014 vide registration number
INH000000164. Angel or its associates has not been debarred/ suspended by SEBI or any other regulatory authority for accessing
/dealing in securities Market. Angel or its associates/analyst has not received any compensation / managed or
co-managed public offering of securities of the company covered by Analyst during the past twelve months.
This document is solely for the personal information of the recipient, and must not be singularly used as the basis of any investment
decision. Nothing in this document should be construed as investment or financial advice. Each recipient of this document should make
such investigations as they deem necessary to arrive at an independent evaluation of an investment in the securities of the companies
referred to in this document (including the merits and risks involved), and should consult their own advisors to determine the merits and
risks of such an investment.
Reports based on technical and derivative analysis center on studying charts of a stock's price movement, outstanding positions and
trading volume, as opposed to focusing on a company's fundamentals and, as such, may not match with a report on a company's
fundamentals. Investors are advised to refer the Fundamental and Technical Research Reports available on our website to evaluate the
contrary view, if any.
The information in this document has been printed on the basis of publicly available information, internal data and other reliable
sources believed to be true, but we do not represent that it is accurate or complete and it should not be relied on as such, as this
document is for general guidance only. Angel Broking Pvt. Limited or any of its affiliates/ group companies shall not be in any way
responsible for any loss or damage that may arise to any person from any inadvertent error in the information contained in this report.
Angel Broking Pvt. Limited has not independently verified all the information contained within this document. Accordingly, we cannot
testify, nor make any representation or warranty, express or implied, to the accuracy, contents or data contained within this document.
While Angel Broking Pvt. Limited endeavors to update on a reasonable basis the information discussed in this material, there may be
regulatory, compliance, or other reasons that prevent us from doing so.
This document is being supplied to you solely for your information, and its contents, information or data may not be reproduced,
redistributed or passed on, directly or indirectly.
Neither Angel Broking Pvt. Limited, nor its directors, employees or affiliates shall be liable for any loss or damage that may arise from
or in connection with the use of this information.